
10 monitoring tools for Linux system administrators you should know about

Our job as system administrators has always had two things that never seem to disappear, the first one is backing up data and the second one is to monitor this and to monitor that. In this article we are going to check out some of the best Linux monitoring tools in the terminal, starting with number 10 the all well known and built in top command.
Article content:
- The Top Monitoring Tool
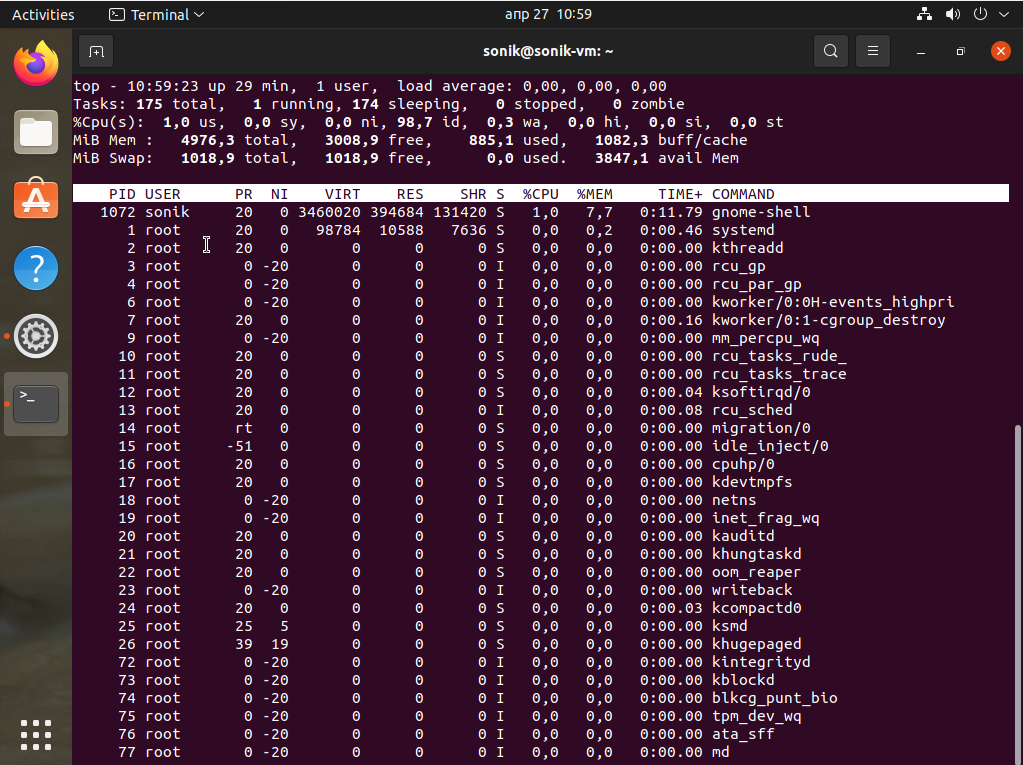
In 10th place we are going to check out the top command, it displays Linux processes and also provides a dynamic real-time view of a running system a.k. actual process activity. By default, it displays the most CPU-intensive tasks running on the server and updates the list every five seconds.
- The Vmstat Memory Monitoring Tool
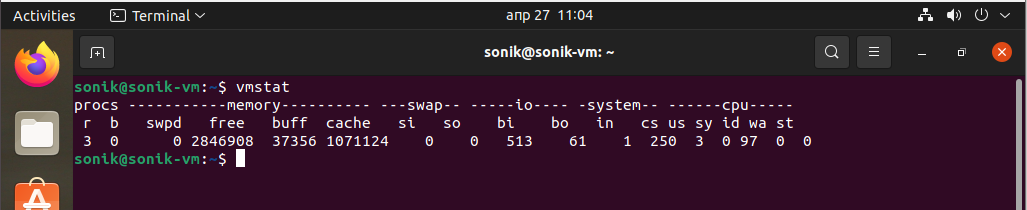
In 9th place, vmstat (virtual memory statistics) is a computer system monitoring tool that collects and displays summary information about operating system memory, processes, interrupts, paging and block I/O. Users of vmstat can specify a sampling interval which permits observing system activity in near-real time.
The vmstat tool is available on most Unix and Unix-like operating systems, such as FreeBSD, Linux or Solaris.
- The Htop Monitoring Tool
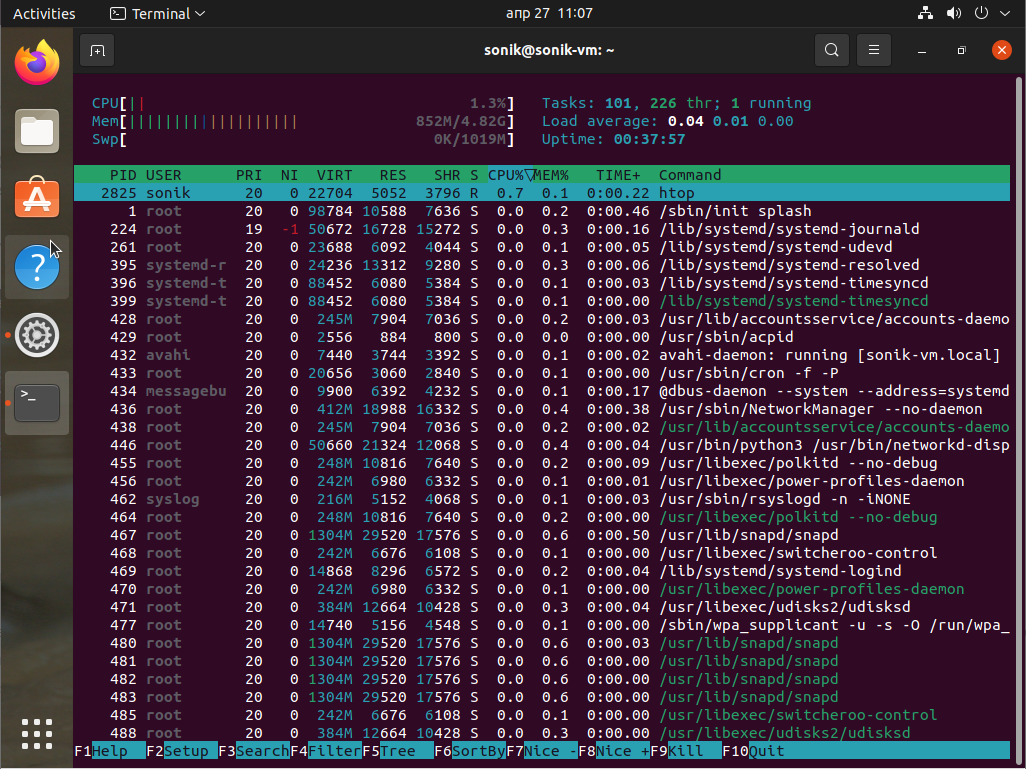
In 8th place, htop is an interactive system-monitor process-viewer and process-manager. It is designed as an alternative to the Unix program top. It shows a frequently updated list of the processes running on a computer, normally ordered by the amount of CPU usage. Unlike top, htop provides a full list of processes running, instead of the top resource-consuming processes. htop uses color and gives visual information about processor, swap and memory status. htop can also display the processes as a tree.
# How to install htop in Ubuntu

sudo apt install htop
- The Bmon Monitoring Tool
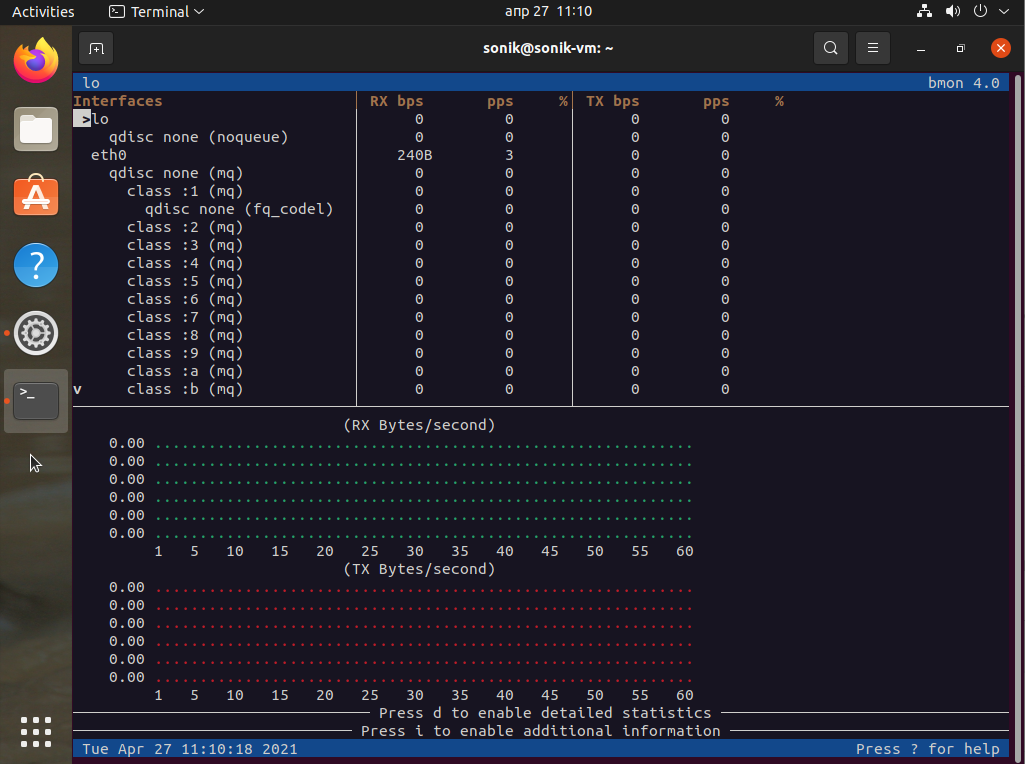
bmon is a simple yet powerful, text-based network monitoring and debugging tool for Unix-like systems, which captures networking related statistics and displays them visually in a human friendly format. It is a reliable and effective real-time bandwidth monitor and rate estimator.
# How to nstall bmon in Ubuntu

sudo apt install bmon
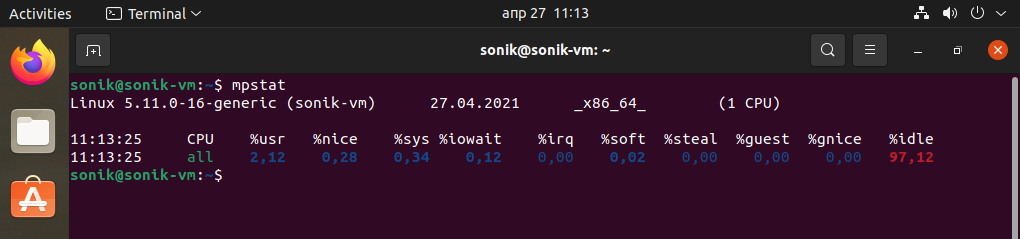
- The Mpstat Monitoring Tool
The mpstat command writes to standard output activities for each available processor, processor 0 being the first one. Global average activities among all processors are also reported. The mpstat command can be used both on SMP and UP machines, but in the latter, only global average activities will be printed. If no activity has been selected, then the default report is the CPU utilization report.
# How to install mpstat in Ubuntu

sudo apt install sysstat
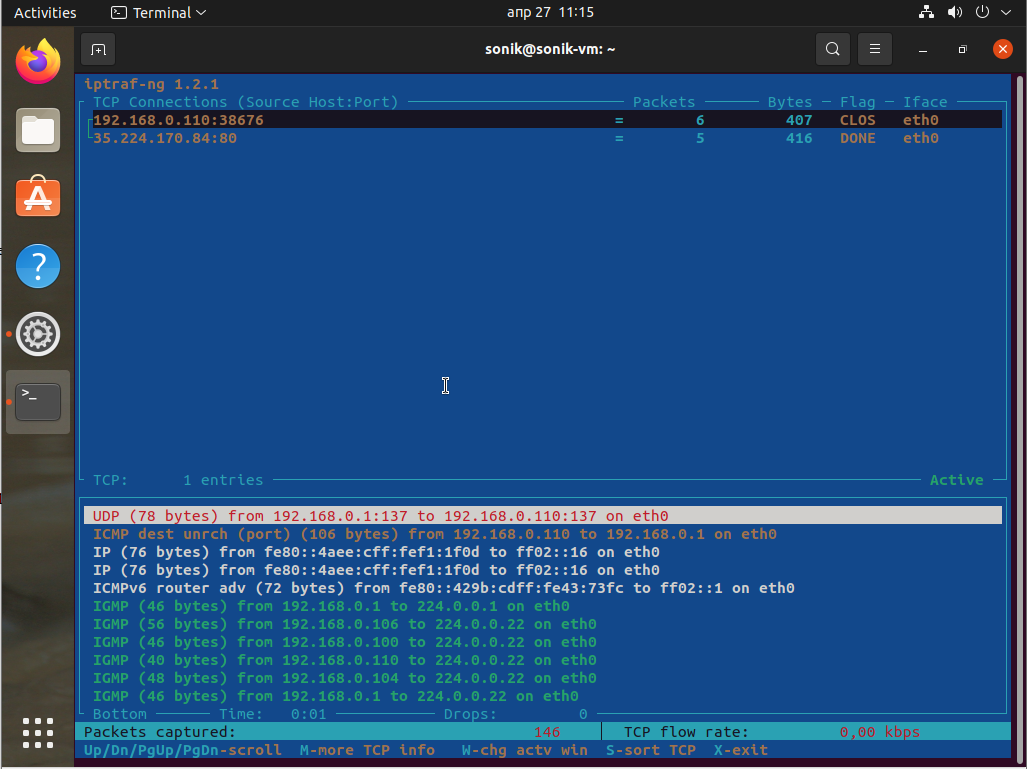
- The Iptraf Interface Monitoring Tool
IPTraf is a console-based network statistics utility for Linux. It gathers a variety of figures such as TCP connection packet and byte counts, interface statistics and activity indicators, TCP/UDP traffic breakdowns, and LAN station packet and byte counts.
# How to install iptraf in Ubuntu

sudo apt install iptraf-ng
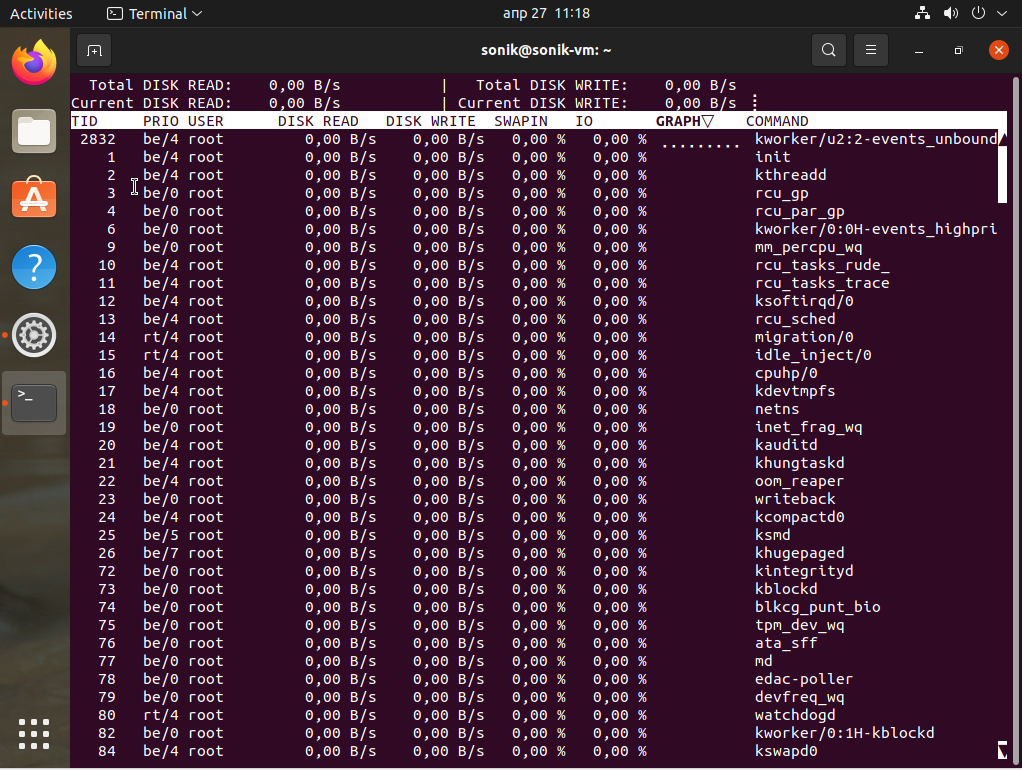
- The Iotop Monitoring Tool
iotop command monitor, I/O usage information, using the Linux kernel. It shows a table of current I/O usage sorted by processes or threads on the server.
# How to install iotop in Ubuntu

sudo apt install iotop-c
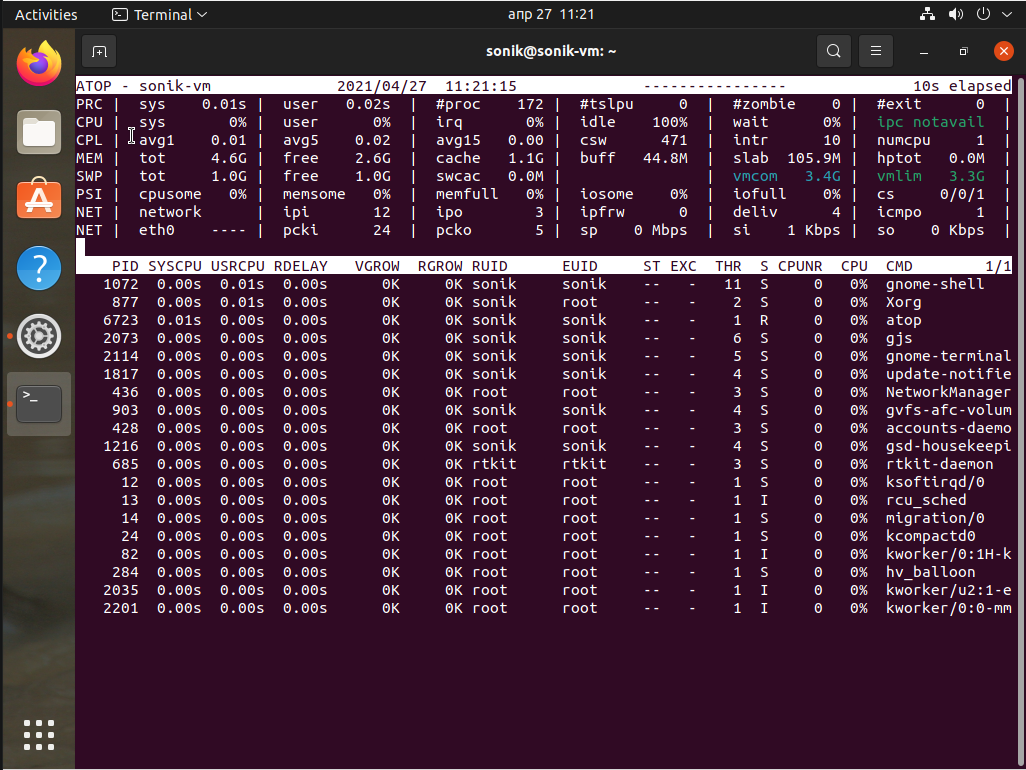
- The Atop Performance Monitoring Tool
Atop is an ASCII full-screen performance monitor which can log and report the activity of all server processes. One feature I really like is that atop will stay active in the background for long-term server analysis (up to 28 days by default).
Once atop is launched, by default, it will show system activity for CPU, memory, swap, disks and network in 10 second intervals. In addition, for each process and thread you can analyse CPU utilization, memory consumption, disk I/O, priority, username, state, and even exit codes.
# How to install atop in Ubuntu

sudo apt install atop
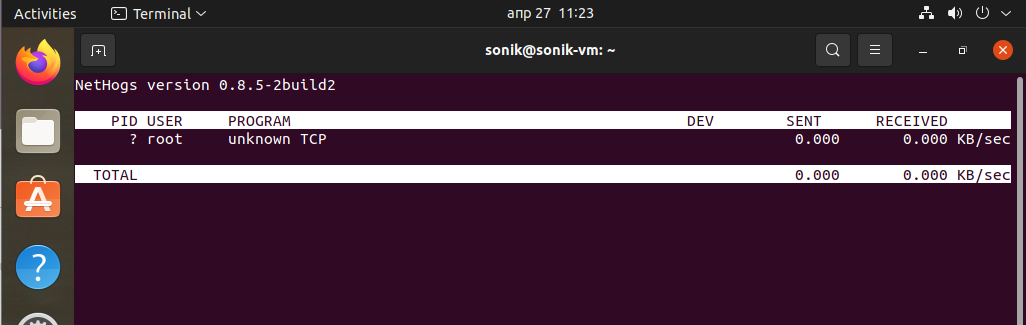
- The Nethogs Monitoring Tool
NetHogs is a small but handy net top tool. It groups bandwidth by process name such as Firefox, wget and so on. If there is a sudden burst of network traffic, start NetHogs. You will see which PID is causing bandwidth surge.
# How to install nethogs in Ubuntu

sudo apt install nethogs
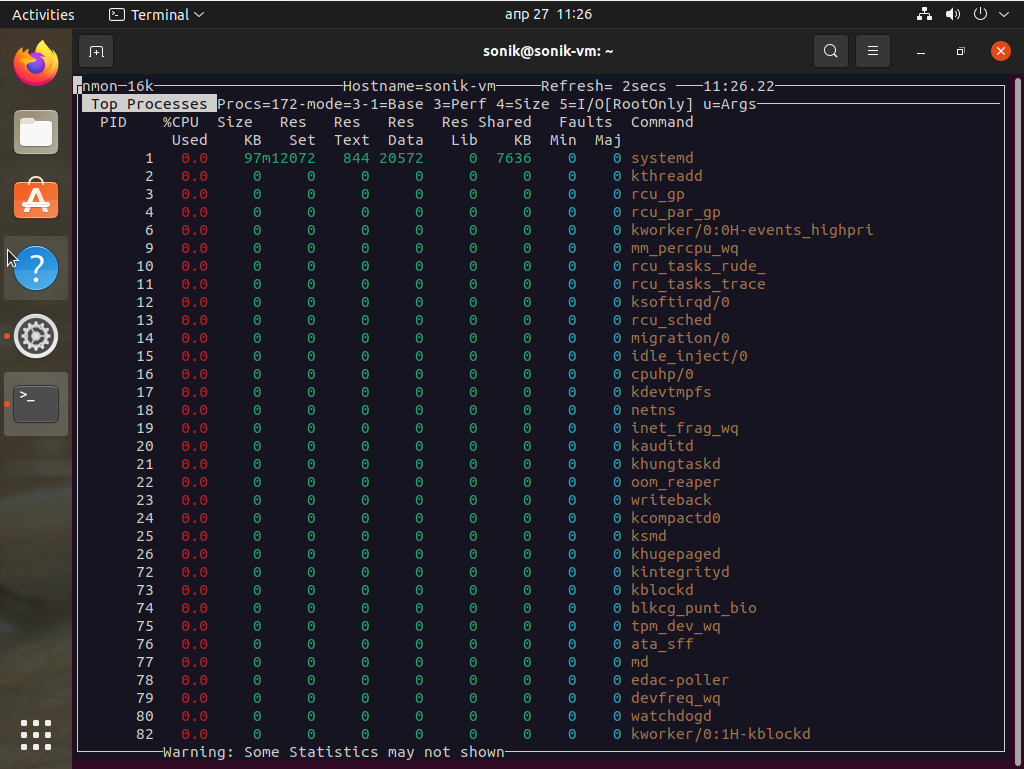
- The Nmon Monitoring Tool
nmon is a Linux sysadmin’s ultimate tool for the tunning purpose. It can show CPU, memory, network, disks, file systems, NFS, top process resources and partition information from the cli.
# How to install nmon in Ubuntu

sudo apt install nmon
Did I miss something? Please add your favorite system motoring tool in the comments.
Here Is A Quick Video On Install And Review
Conclusion
In this article we reviewed monitoring tools for Linux system administrators you should know about.
- Another article that is 10 Best Lite Command Line Text Editors In Linux
—————————————————————————————————————–
We hope you enjoyed this article. if that is so please rate this page with the stars bellow and subscribe to our YouTube channel or follow us on twiter.